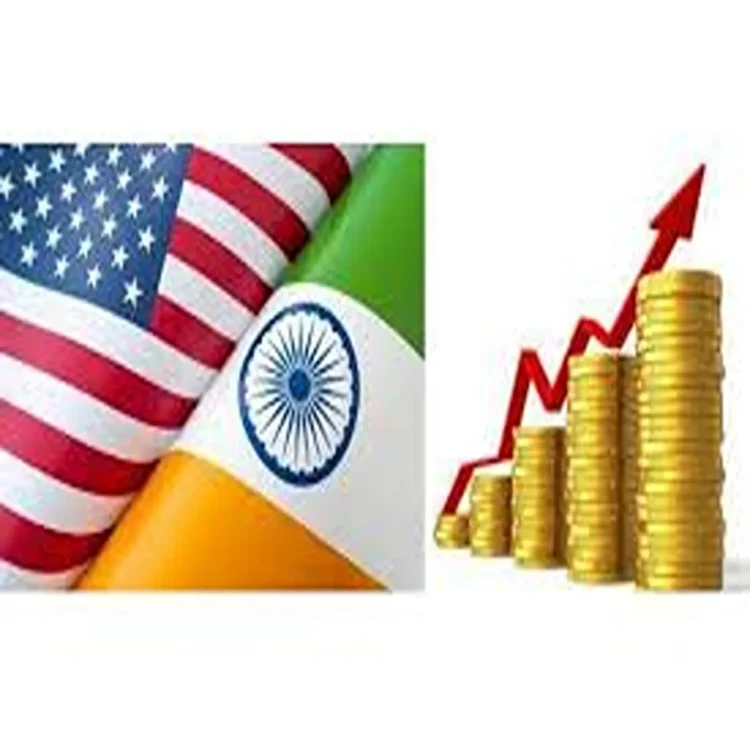
TradeDeficit – US Trade Gap Widens as India Emerges Key Partner
TradeDeficit – The United States reported a goods trade deficit of $54.91 billion with India over the past year, placing India among the country’s major deficit partners. The latest official figures also showed a broader increase in the US trade gap during February, reflecting shifts in both imports and exports.
Monthly Trade Gap Shows Moderate Increase
In February, the US overall trade deficit rose to $57.35 billion, marking an increase of $2.67 billion compared to January. Despite this rise, the figure remained about 11 percent lower than the average recorded over the past 12 months. The monthly change highlights ongoing fluctuations in trade activity, largely influenced by demand patterns and global supply conditions.
Exports during the month were valued at $314.8 billion, while imports climbed to $372.1 billion. The faster growth in imports compared to exports contributed significantly to the widening deficit.
Goods and Services Performance Diverge
A closer look at trade components shows contrasting trends between goods and services. The goods trade deficit reached $84.60 billion, increasing from the previous month. In contrast, the services sector maintained a surplus of $27.26 billion, though this figure saw a slight decline.
This difference reflects the United States’ continued strength in services such as finance, travel, and intellectual property, even as it faces persistent challenges in balancing goods trade.
India’s Growing Role in US Trade
India continues to play a notable role in US trade dynamics. In February alone, the US recorded a goods trade deficit of approximately $3.5 billion with India. Over the 12-month period ending February 2026, India accounted for around 5.01 percent of the total US goods trade deficit.
The data indicates steady and expanding trade flows between the two countries, particularly in key sectors such as pharmaceuticals and engineering products.
Imports from India Highlight Sector Strength
Goods imports from India totaled $101.97 billion over the past year, underscoring India’s position as an important supplier to the US market. These imports include a wide range of products, notably pharmaceutical items, machinery, and industrial goods.
Additionally, these imports generated $12.34 billion in customs duties for the United States. The average tariff applied on these goods stood at 12.12 percent, reflecting existing trade policies and tariff structures.
Larger Trade Imbalances with Other Countries
While India remains a significant partner, the US trade deficit is more heavily influenced by larger imbalances with countries such as Mexico, Vietnam, and China. These nations continue to account for the largest shares of the US goods trade deficit.
Their dominant role highlights broader global supply chain dependencies and manufacturing trends that shape US import patterns.
Export Growth Driven by Industrial Shipments
US exports saw an increase in February, supported by higher shipments of industrial supplies and materials. Key contributors included nonmonetary gold and natural gas. Services exports also experienced modest growth during the same period.
On the import side, demand rose sharply for capital goods, computers, semiconductors, crude oil, and pharmaceutical products. These categories remain central to US consumption and industrial activity.
Yearly Trends Indicate Partial Improvement
Despite the monthly rise in the deficit, longer-term data suggests some improvement in the overall trade balance. Year-to-date figures show a narrowing deficit compared to the same period last year. This trend is attributed to a combination of rising exports and a slight decline in imports on an annual basis.
In February, the United States collected $21.24 billion in import duties, which was about 13 percent below the 12-month average. The average applied duty rate stood at 8.48 percent, indicating relatively stable tariff levels.
Overall, the data reflects a complex trade environment where short-term fluctuations coexist with gradual long-term adjustments, shaped by global demand, domestic consumption, and evolving international partnerships.